AWS Spot instances offer a discount off on-demand rates in exchange for the risk of instance preemption (running instances stopped) and unavailability (no capacity to start instances). I have long held the belief that spot instances are underpriced, as most tenants underestimate their tolerance for preemption or overestimate its likelihood. In reality, instance preemption is rare in most instance families, and tolerating a large set of different instance types (such as by taking advantage of equivalent instances) can allow drastic savings over on-demand with minimal negative impact. A well-designed spot placement strategy has generally been able to achieve much of the max savings (“up to 90%”) that Amazon claims. In effect, spot compute leverages a market inefficiency in which other tenants pay too much.
It appears, however, that this is changing, and quickly. As macroeconomic conditions change and businesses look to trim costs, cloud bills are on the chopping block. It has recently been reported that Amazon is trying to help customers cut costs through more efficient deployments. Third-party data can give us some idea where this optimization is occuring: on-demand instance usage by Vantage customers dropped to its lowest ever (around 30%). Amazon is likely pushing a similar trend globally, encouraging customers to switch to savings plans/reserved instances and spot instances.
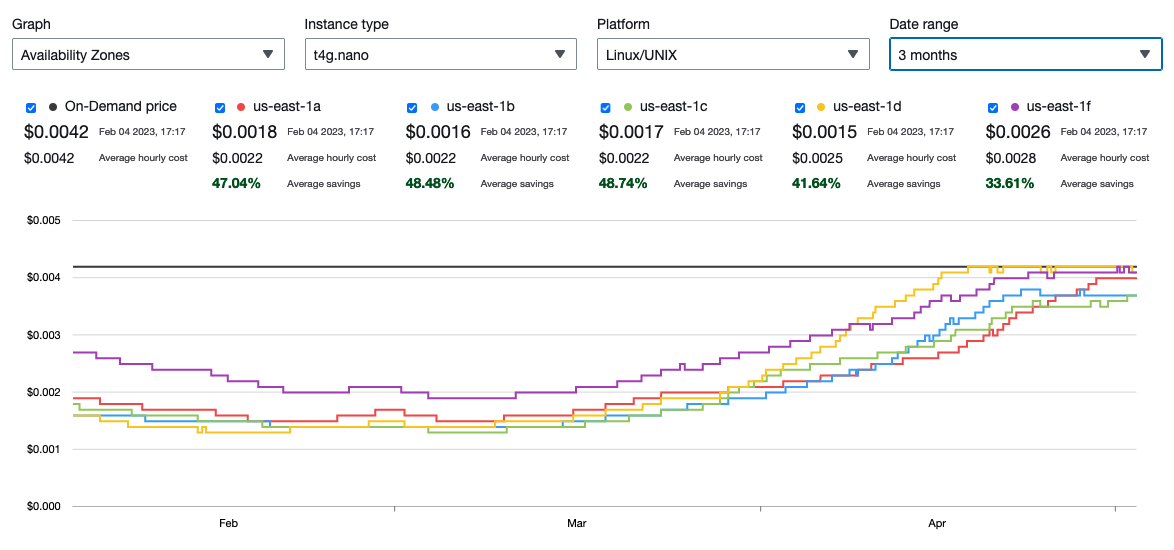
t4g.nano spot prices in us-east-1. Yikes!
At the same time, if you’re already using spot instances you may have noticed your savings start to dry up. I know I did! So naturally I went out and tried to measure it. Is this spike in spot prices just a blip in the radar, or have macroeconomic conditions also had an effect on spot pricing?
Spot price trends
Any good experiment has a hypothesis. Today, we’re testing the hypothesis that there’s only so much spot savings to go around. By this I mean in aggregate: as more tenants move to spot instances will Amazon bring in less money, or is there some fixed amount of overall spot discount that is “split” between customers? The last couple months would argue that our hypothesis is true, and as more businesses use spot instances the savings will continue to diminish. For example:
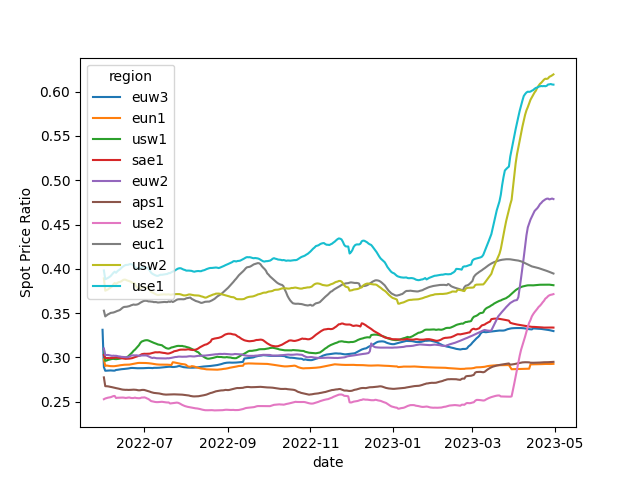
This figure shows aggregate spot ratios (the mean ratio of spot price to on-demand price, across availability zones/instance types) within each region over the past year. These values shift with supply and demand constantly, but historically have kept within a tight range. That is, until the past few months. Since the start of 2023, spot ratios have spiked as much as 55% (in us-east-1). In four of the largest AWS regions1 prices have skyrocketed, and others may not be far behind.
Regardless of what is causing it, these increased prices are surely putting pressure on cloud customer compute budgets. Next, we’ll take a deeper dive and try to pin down why they’re occuring, and also some ideas on what to do about it.
Inferring demand: preemption rates
Without more details, one might suspect that this is just Amazon playing with pricing levers. One way that we can differentiate this is by looking at the actual underlying infrastructure: if actual spot instance demand is increasing then we would expect to see an increase in instance preemptions.
Thankfully, our research group manages a large-scale deployment of t3/t4 spot instances. Between October 2022 and today, we’ve provisioned 5.5 million spot instances on AWS across all regions. We use these to study how cloud providers allocate IP addresses and its effect on tenant security. Each server runs for 10 minutes each before shutting down, but we also track when instances get preempted. Here’s a plot of preemption rates for spot instances in regions with price spikes vs. without:
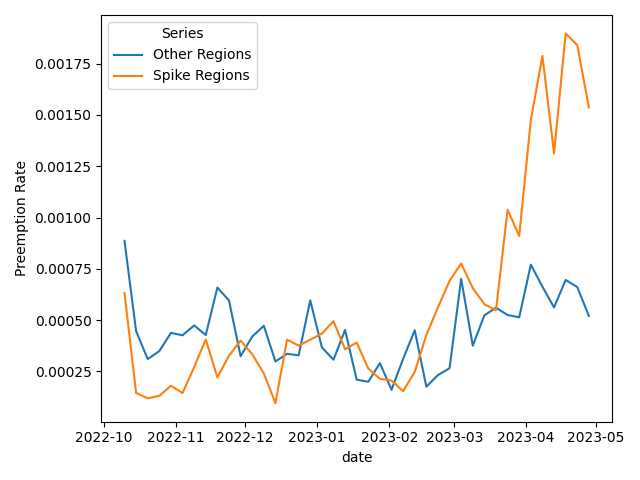
We see a near quadrupling in preemption rates in the span of just a few months! Note that our spot pools are diversified across instance families, availability zones, and in this case even regions! The data suggest a marked increase in aggregate spot instance demand. Note that these preemption rates are across the 10-minute windows that instance are deployed for, so in a given month the odds of being preempted are much higher!
What instance families are most affected?
Of course, increase in demand may not affect all instance types equally. Let’s look at spot price changes by instance family. In this table, note that prices are normalized as a fraction of the on-demand cost:
| Family | Price 2023-01-01 | Price 2023-05-01 | Change |
|---|---|---|---|
| m3 | 0.24 | 0.53 | +158% |
| a1 | 0.32 | 0.77 | +148% |
| t3a | 0.35 | 0.75 | +115% |
| g5g | 0.34 | 0.69 | +108% |
| t4g | 0.35 | 0.69 | +105% |
| inf1 | 0.34 | 0.66 | +105% |
| t2 | 0.31 | 0.61 | +97% |
| c6id | 0.33 | 0.6 | +90% |
| c6in | 0.26 | 0.49 | +89% |
| c5a | 0.4 | 0.74 | +88% |
| t3 | 0.32 | 0.61 | +87% |
| g3 | 0.31 | 0.57 | +87% |
| g4ad | 0.32 | 0.6 | +86% |
| h1 | 0.36 | 0.65 | +85% |
| m6in | 0.24 | 0.43 | +85% |
| m4 | 0.33 | 0.59 | +84% |
| c4 | 0.32 | 0.57 | +84% |
| c5ad | 0.41 | 0.73 | +83% |
| c5n | 0.31 | 0.53 | +82% |
| m6idn | 0.21 | 0.38 | +81% |
| m6id | 0.32 | 0.52 | +80% |
| r3 | 0.21 | 0.35 | +80% |
| r4 | 0.25 | 0.43 | +79% |
| vt1 | 0.56 | 0.78 | +77% |
| m6a | 0.41 | 0.69 | +77% |
| c6a | 0.44 | 0.75 | +77% |
| m5a | 0.4 | 0.69 | +76% |
| r5ad | 0.27 | 0.45 | +75% |
| c3 | 0.48 | 0.69 | +75% |
| r5a | 0.3 | 0.51 | +74% |
| r6a | 0.33 | 0.54 | +72% |
| c7g | 0.45 | 0.79 | +72% |
| r6in | 0.19 | 0.32 | +71% |
| c6gn | 0.38 | 0.62 | +71% |
| m6i | 0.36 | 0.59 | +70% |
| r6idn | 0.18 | 0.29 | +70% |
| m6gd | 0.35 | 0.59 | +69% |
| c6gd | 0.38 | 0.66 | +69% |
| m5ad | 0.38 | 0.58 | +67% |
| r6id | 0.26 | 0.41 | +67% |
| m5n | 0.35 | 0.52 | +66% |
| m5zn | 0.26 | 0.38 | +65% |
| m5d | 0.31 | 0.49 | +65% |
| c6i | 0.36 | 0.6 | +64% |
| c5d | 0.32 | 0.5 | +62% |
| r5n | 0.26 | 0.39 | +62% |
| c6g | 0.45 | 0.72 | +62% |
| m5 | 0.33 | 0.54 | +62% |
| r6gd | 0.3 | 0.48 | +61% |
| im4gn | 0.3 | 0.48 | +60% |
| m6g | 0.41 | 0.65 | +59% |
| r5d | 0.26 | 0.39 | +59% |
| m5dn | 0.35 | 0.45 | +59% |
| r5b | 0.32 | 0.39 | +58% |
| r6i | 0.3 | 0.44 | +56% |
| g4dn | 0.31 | 0.48 | +55% |
| r6g | 0.32 | 0.49 | +52% |
| x2gd | 0.38 | 0.51 | +51% |
| z1d | 0.33 | 0.48 | +51% |
| r5dn | 0.29 | 0.37 | +46% |
| c5 | 0.36 | 0.48 | +35% |
| g5 | 0.33 | 0.44 | +31% |
| x2idn | 0.38 | 0.43 | +31% |
| r5 | 0.28 | 0.35 | +30% |
| x1 | 0.3 | 0.39 | +28% |
| c1 | 0.56 | 0.27 | +26% |
| i3 | 0.33 | 0.38 | +16% |
| d3 | 0.34 | 0.36 | +15% |
| i4i | 0.35 | 0.36 | +11% |
| is4gen | 0.3 | 0.33 | +11% |
| i2 | 0.3 | 0.33 | +8% |
| d2 | 0.3 | 0.31 | +4% |
| dl1 | 0.3 | 0.31 | +3% |
| i3en | 0.31 | 0.31 | +1% |
| p2 | 0.42 | 0.38 | +0% |
| trn1 | 0.3 | 0.3 | +0% |
| p4d | 0.3 | 0.3 | +0% |
| p3dn | 0.3 | 0.3 | +0% |
| x1e | 0.3 | 0.3 | +0% |
| d3en | 0.41 | 0.32 | -7% |
| g3s | 0.35 | 0.3 | -11% |
| x2iedn | 0.43 | 0.31 | -12% |
| p3 | 0.39 | 0.3 | -13% |
| f1 | 0.43 | 0.31 | -14% |
| x2iezn | 0.46 | 0.3 | -15% |
| g2 | 0.84 | 0.52 | -24% |
| m1 | 0.35 | 0.21 | -25% |
| m2 | 0.61 | 0.26 | -37% |
| t1 | 0.5 | 0.19 | -39% |
There’s quite a bit of range here, though the overall trend is positive. The price reductions are more of an exception that proves the rule, as older families (such as m1 and t1) have too poor of compute performance to be price competitive.
Managing spot instance cost
Overall, I think we’ve entered a race to the bottom in terms of spot discounts. For now, you can likely still reduce your bills by diversifying across equivalent instances in other families. The largest price win you can get would be to move to a region that has not (yet!) seen price spikes, but this is probably not feasible for a lot of architectures.
On the plus side, spot prices can’t keep rising forever. Since Amazon’s new spot pricing model, it appears that spot prices rarely if ever exceed on-demand prices. If your architecture is designed to accept preemption and the cost of provisioning replacement instances isn’t too high (e.g., compute time to start a new instance), you probably won’t turn out worse than if you used on demand instances. Using spot instances can also be seen as a sort of built-in chaos monkey, since even on-demand instances can fail. However, as the discount on spot instances erodes it may make less and less sense to invest in the resilient design to use them.
Takeaways
Spot instances have offered an incredible price advantage to those who are willing to architect around preemptible instances, but the party may be coming to close. While there is still some savings to be had, organizations should make their architecture decisions in light of these decaying benefits, and more strongly consider approaches with more guaranteed savings (such as Savings Plans) when they have predictable usage.
-
By size of IPv4 range ↩︎